Dotplot
Dotplot enables users to compare two assemblies. It is useful to find similar and repetitive regions as well as structural variation.
Hint: It may also be useful to align an assembly with itself!
How to get there
In the genome table, select exactly two genomes (using Shift or Ctrl) and open the
context menu using right click. Then, click on “Compare the assemblies using dotplot”.
Click here for an example.
Usage
Zoom:
- Click and drag to zoom in
- Double-click to zoom out
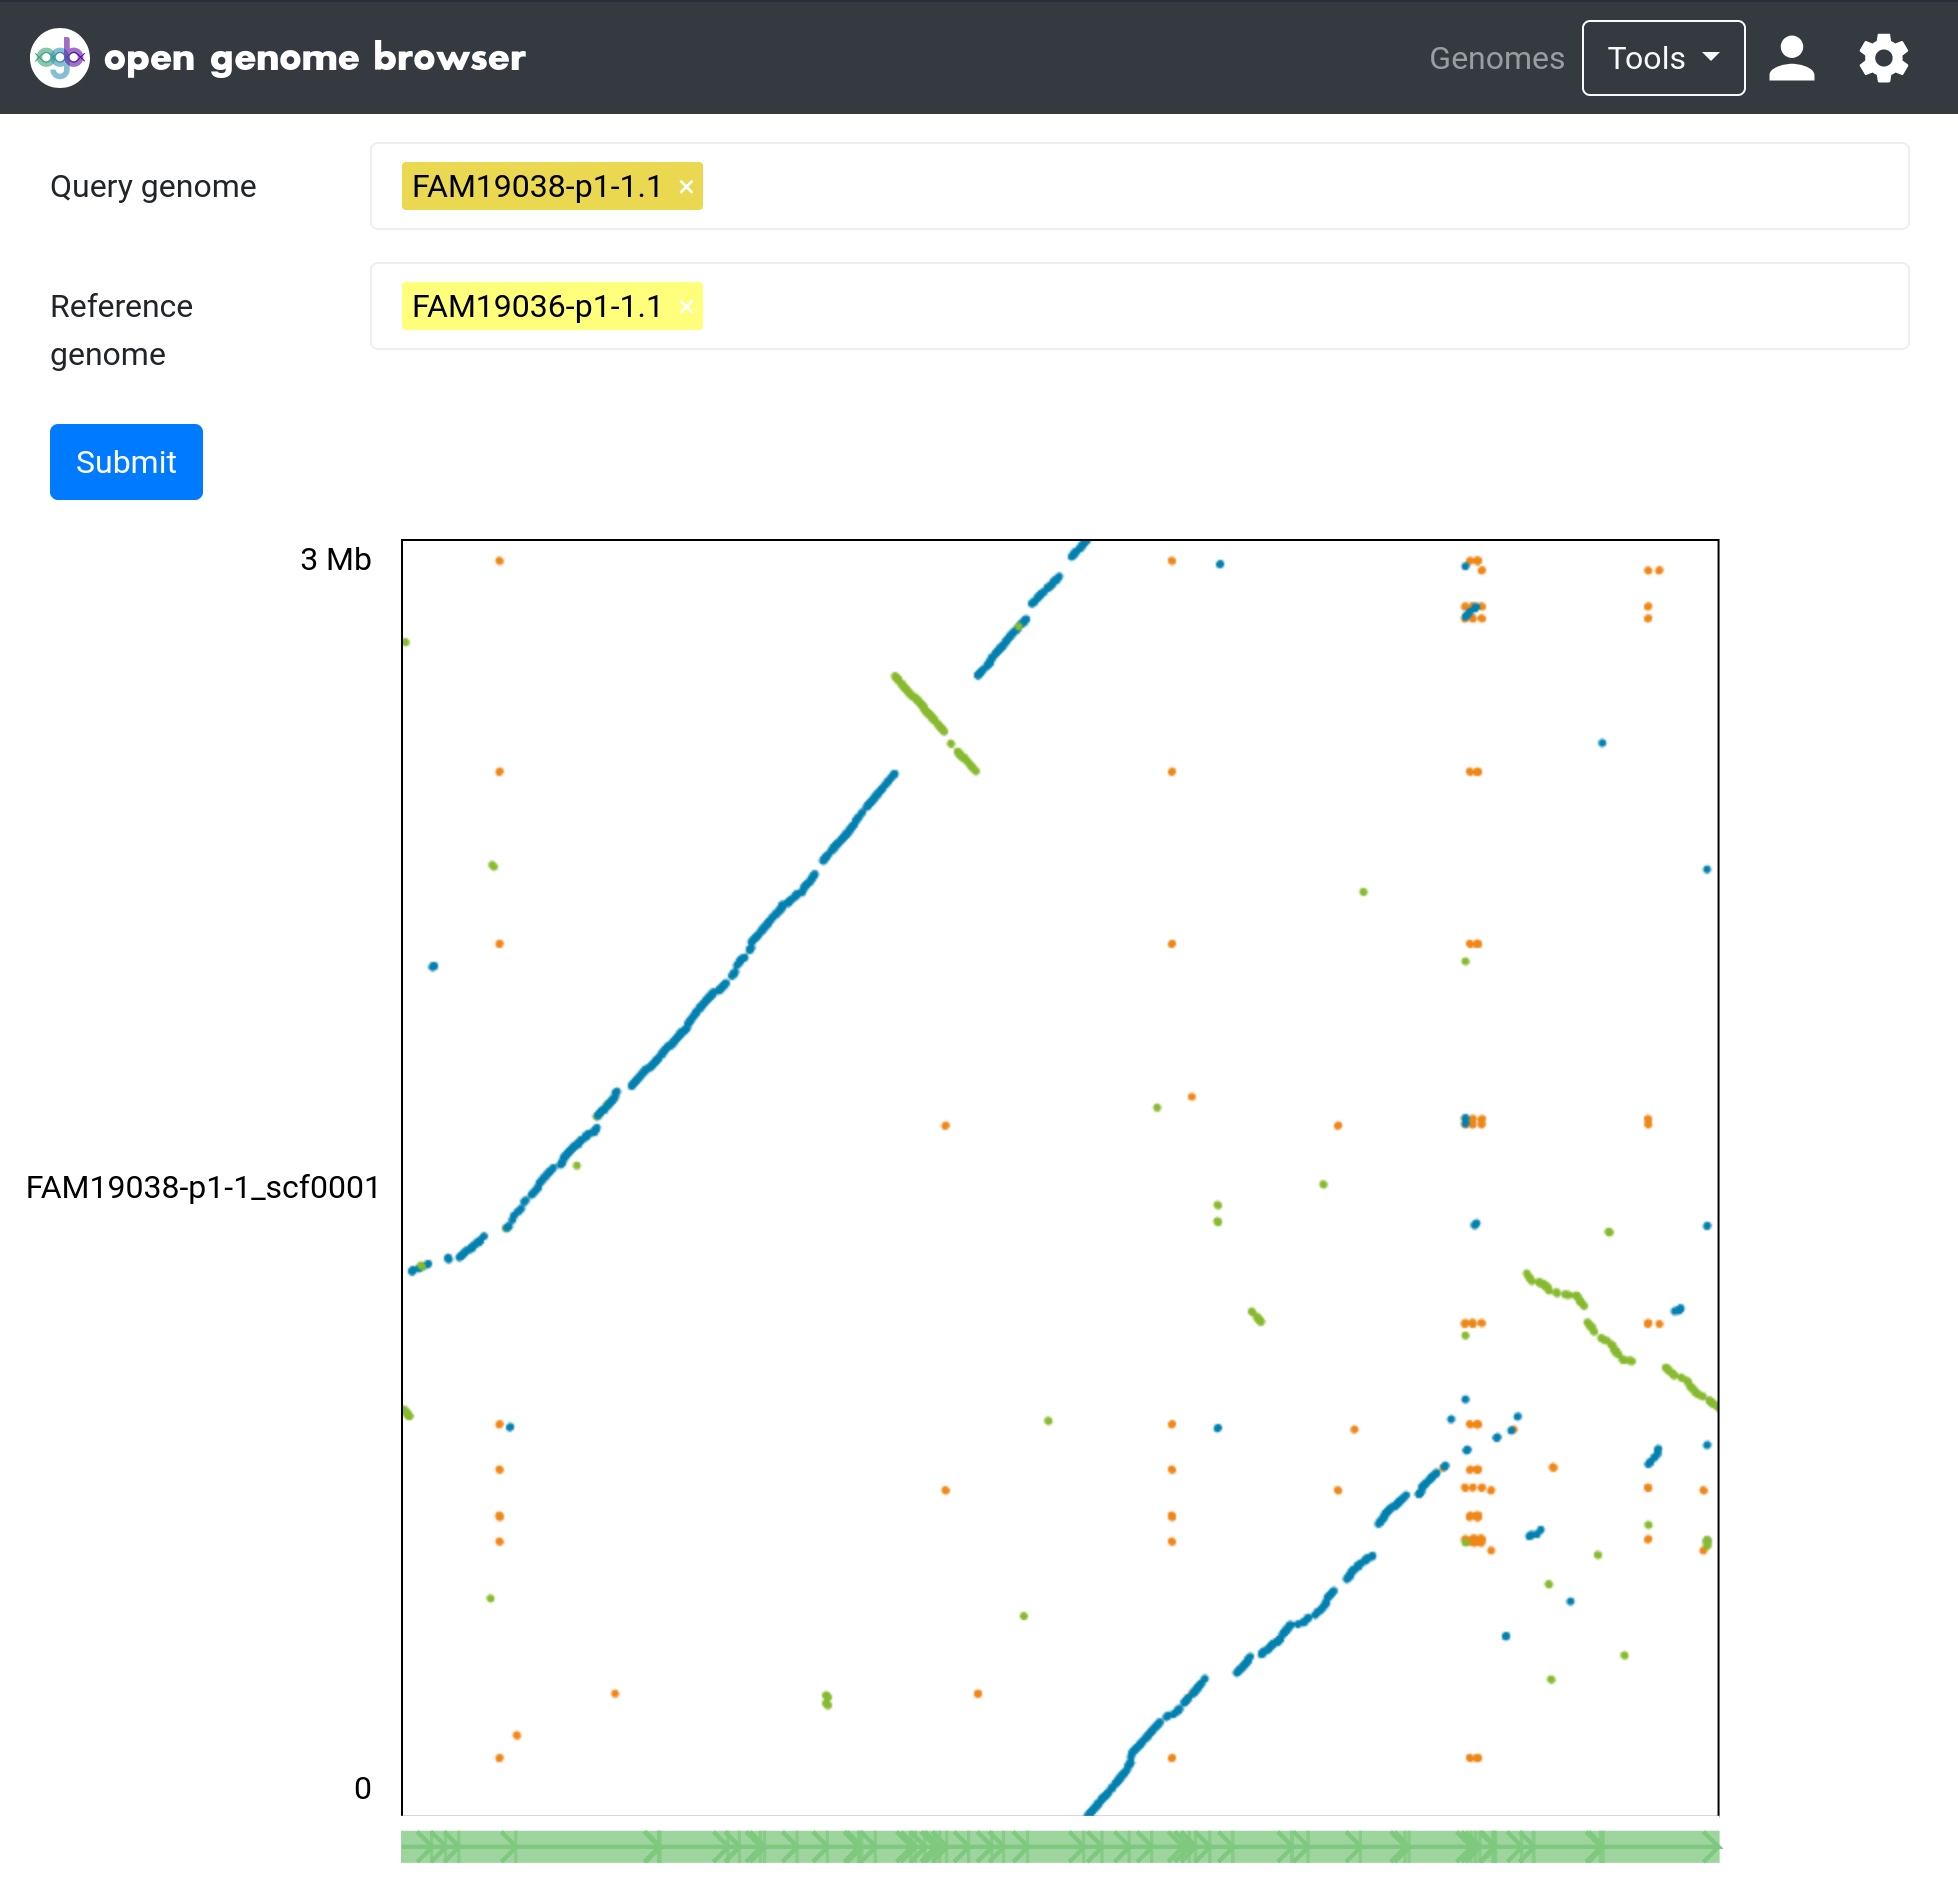
Colors (default):
- blue: forward alignments
- green: reverse alignments
- orange: repetitive alignments
How it works
First, the assemblies are aligned using nucmer (part of the mummer4 package). Then, the interactive dot plot
viewer Dot is used to visualize and animate the result.
Parameters
The most important parameter is nucmers mincluster parameter. It sets the minimum length of a cluster. A higher value will decrease the
sensitivity of the alignment, but will also result in more confident results.
In the settings sidebar (click on the settings wheel), many options are available to change the looks of the plot.