Gene trait matching
Gene-trait matching is an effective approach to identify genes that could be responsible for an observed phenotype.
The principle is simple: If one group of genomes has a specific trait that another does not, search for orthologous genes (or functional annotations) that occur in one group and are absent in the other.
Usage
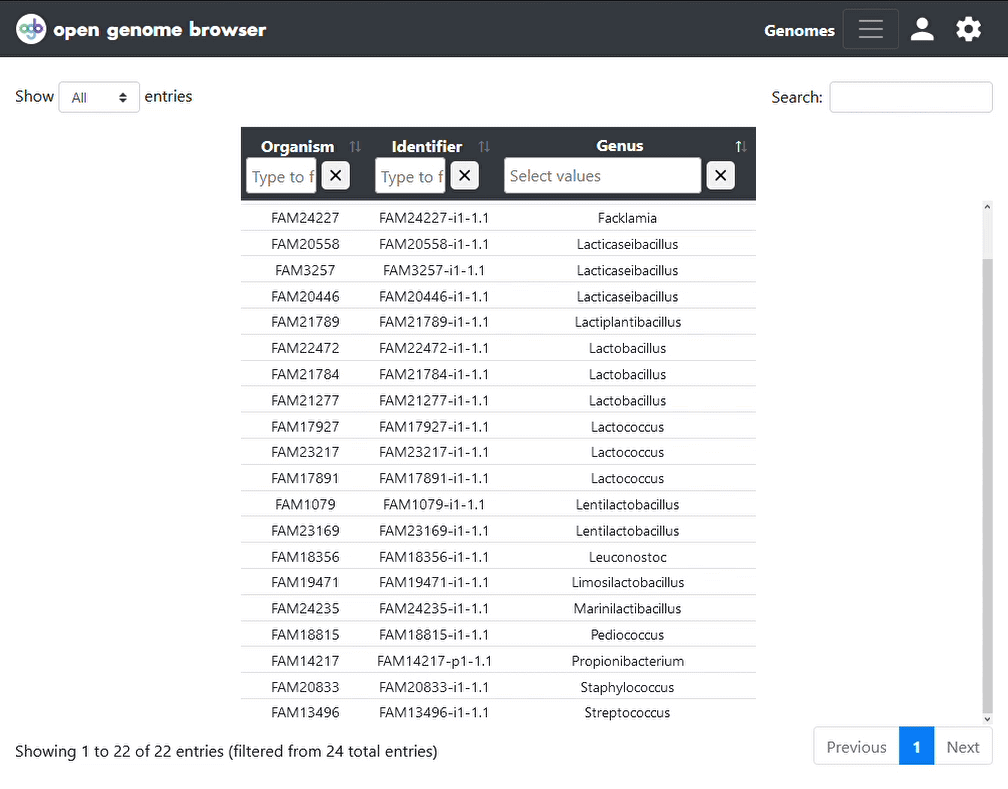
Open the gene trait matching page and enter two non-intersecting groups of genomes, for example: Lactobacillaceae vs Propionibacteriaceae and Streptococcaceae .
The resulting table can be downloaded in CSV format through the settings sidebar.
Example use case
The following example is based on a real experiment with 39 strains from the same microbial genus. 23 strains can metabolise a specific compound (green), the others (red) can not.

To find the responsible gene(s), open the gene-trait-matching view, define the two groups of genomes, and click on ‘Submit’.
In this case, gene-trait matching found a strong correlation of the trait with a small number of orthologs. A closer look indicated that these orthologous genes were always located close to each other on the genome. A follow-up RNA-Seq experiment also showed a link between the phenotype and this gene cluster.
This experiment was ideal for gene-trait matching because the strains were relatively closely related and the trait was distributed amongst different clusters. If this is not the case, gene-trait matching is less likely to work. For example, had the phenotype been strongly correlated with the phylogenetic clusters, like in the image below, too many genes would probably have shown up as significantly different between the two groups.

Background
By default, OpenGenomeBrowser will run a Fisher’s exact test for each orthologous gene and apply Benjamini/Hochberg multiple testing correction (alpha = 10 %).
Caution: It is not guaranteed that the assumption of Fisher’s test, that all isolates have a random and independently distributed probability for exhibiting each state, is valid because of population structure. See the example above. For more information, read the paper Brynildsrud et al, Genome Biol, 2016 about the Scoary tool.
(In the future, I will probably implement something like Scoary’s empirical p-value as an additional output column.)
Advanced usage
In the settings sidebar (weel on top right), it is possible to change…
- test method
fast-fisher: Faster, custom implementation of Fisher’s exact test. Original algorithm by painyeph, Cython implementation by me (Thomas Roder)fisher: Reference implementation in the scipy library, should give almost exactly the same result asfast-fisher, but about 100x slower thanfast-fisherboschloo: Boschloo’s exact test is a more powerful variant of Fisher’s exact test that can be used when the column sums of the contingency table are known in advance, which is the case here (the column sums are the total number of genomes that have or lack the trait). While the p-values may be less conservative, benchmarks on simulated data indicate that Fisher’s test is a better method to rank the genes.
- the category of annotations to use
- the multiple testing algorithm
- the associated alpha value